Lunar petrographic imaging - showing minerals and age in colors
Amateur Moon images may be razor sharp but they usually are gray... Except of trying to increase color intensities on a standard color image there are other ways of making colorful Moon images that will also showcase differences in the surface composition or age. Petrographic photography uses specific bands to catch absorption bands of minerals present on the Moon. This is quite unknown subject for most of astrophotographers. In this article I'll describe techniques developed by professionals for the Moon.
Diving into petrographic imaging
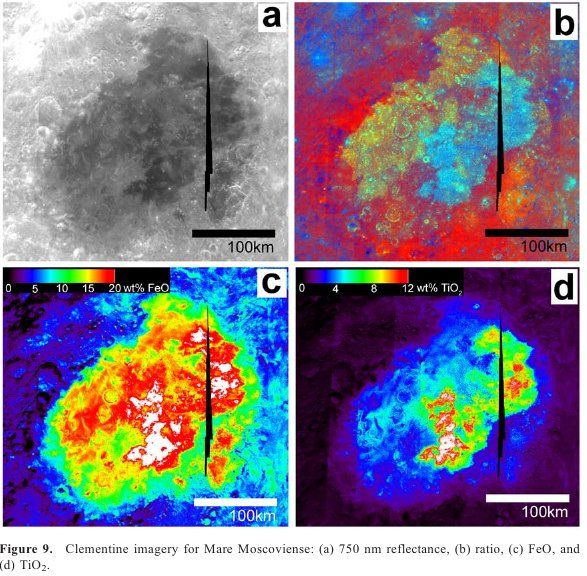
In case of the Moon it all started with images-maps showcasing TiO2 and FeO abundance on the lunar surface. Geologists could tell a lot about given area having those values. Moon was imaged in 3 wavelengths: ~415, 750 and 950 nm. Later more bands were added including long infrared wavelengths. That allowed to discover more minerals like spinels.
Imaging Moon at those wavelengths isn't a big problem. Just a camera and a filter. The harder part was “space weathering” which is making lunar regolith darker and darker over time. Maturity was giving false absorption at bands where some minerals absorbed. To overcome maturity scientists started to divide the absorption wavelength image with an reference image that didn't had the absorption bands. So for FeO 950/750 was used, and for TiO2 ~415/750. This is described on psrd.hawaii.edu. From both indexes (divided images) it was possible to get a multi-color images where blue colors showed TiO2 abundance and brown - FeO. The results can look like so:

Jose Ribero used an even older set of 420/550 for the TiO2 and also got a very good result. Nowadays we can use two bigger sets to determine composition and maturity. I'll describe them later on.
Absorption bands
To differentiate substances on an image you need to catch their unique absorption bands. In case of the Moon minerals it's doable with the common CCD and CMOS cameras (but not very easy). The VIS + IR spectroscopic data for lunar minerals looks like so:

Pyroxene absorb somewhere between 900 and 1000 nm depending on mineral type. Olivine absorbs after 1000 nm. Plagioclase doesn't absorb at those wavelengths. However on the Moon we have rocks that can contain various minerals. For rocks the absorption bands are as follow:
| Rock | Mineral | Absorption bands | Notes |
|---|---|---|---|
| Basalt | High-Ca pyroxene (>50%) | 950 - 1000 nm | |
| Basalt with high olivine | High-Ca pyroxene, olivine (10-20%) | 950 - 1000 nm | Olivine broadens absorption band, moves to slightly higher wavelengths |
| Anorthosite | Plagioclase feldspar, little or no pyroxene (<5%) | No pyroxene absorption bands | |
| Norite | Plagioclase feldspar, low-Ca pyroxene | 930 - 950 nm | |
| Gabbro | High-Ca pyroxene | 970 - 1000 nm | Similar to Basalts, but have lower abundance of pyroxene |
| Gabbro | High-Ca pyroxene with low-Ca pyroxene | 950 - 970 | |
| Dunite | Olivine | 1100 nm | |
| Troctolite | Feldspar with olivine | 1100 nm |

Andesite
Orthoclase and Plagioclase

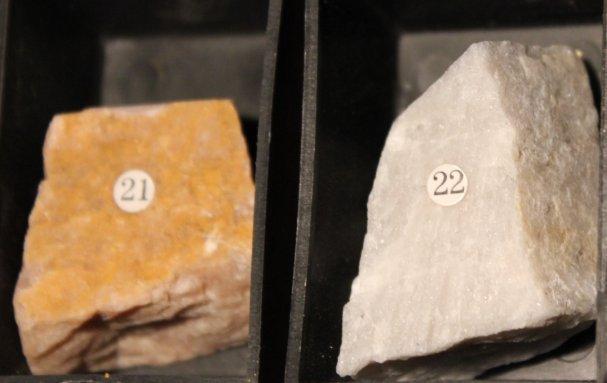
Anorthosite - Duluth Complex, Minnesota

Olivine on a basalt - Spain

Augite crystal - Czech Republic

Chromite and Ilmenite

Granite

Basalt

Gabbro

Diorite
Modern Seleno-Petrography
All the absorption data as well as false color visualization techniques used in petrographic images is described in Selenology Today nr. 19 magazine. For us the most interesting are the false color sets.
maturation ratio image:- Red: 750/415 nm
- Green: 750/1000 nm
- Blue: 415/750 nm
Gives basic informations about the age of the surface as well limited info about the composition. Mature highland soils appear red or orange due to the high glass content. Surfaces low in titanium content also have a reddish color and pyroclastic orange glass deposits have a very deep red color. Freshly excavated lunar features appear blue as do mare surfaces having a high titanium content (ilmenite rich). Mafic components, typically rich in iron, absorb at 1000 nm and appear yellowish green (due to mixture of the reddish orange of mature soil with the green characteristic of mafic absorption) or deep indigo blue (titanium poor basalt). Mature mare soils appear reddish or purplish while freshly exposed mare surfaces appear yellowish. The basalts of the maria give the strongest signals, but weaker mafic components in certain highland features can also give a response. Yellow color signals often indicate freshly excavated basalt features, especially when found in crater and rille walls. Bright blue signals indicate a freshly exposed non-mafic terrain (i.e. such as freshly exposed Anorthosite).
mafic ratio image:
- Red: 750/900
- Green: 750/1000
- Blue: 750/950
Low calcium pyroxenes (orthopyroxenes like Norite or Noritic anorthosite) appear reddish, olivines (such as Olivine, Dunite, Troctolitic anorthosite, and Troctolite) appear brighter green, and high calcium pyroxenes (clinopyroxenes like Gabbro or Anorthositic gabbro) appear bright blue. Anorthosite doesn’t absorb and appears dim grayish green.

The strong green coloration in the maturation image above confirms the mafic nature of the central peaks and adjacent crater wall. The floor of the crater consists of mature regolith with a reticulated pattern of mafic material spread on it. Although it has a strong mafic signature, the mafic element composing the central peak is not olivine. If it were present olivine would have a green signature on the mafic ratio image. Rather, the mafic image coloration supports the mafic element being a pyroxene. It is sometimes possible to differentiate high calcium from low calcium pyroxenes. The color signature of the high calcium pyroxenes (clinopyroxenes) is bluish green through bluish violet on a mafic ratio image while the signature of a low calcium pyroxene (orthopyroxene) is distinctly red. On that basis, it appears that the mafic ratio image above would best support a high calcium pyroxene as the principal mafic component.
There are other interesting features like "dark mantling deposits" - DMD (check volcano.oregonstate.edu) that are marks of past pyroclastic volcanic explosions. To visualize those areas we can use such set:
- Red: 750/415 nm
- Green: 750/950 nm
- Blue: 750 nm

How to divide images?
The easy way is to use the dividing image as a flat on the primary image. The Moon features must be aligned vs each other on both frames for it to work. This could be done in Nebulosity that has an option to save each aligned image as a file and not stack them. More advanced is ImageJ application.Filters for petrographic imaging
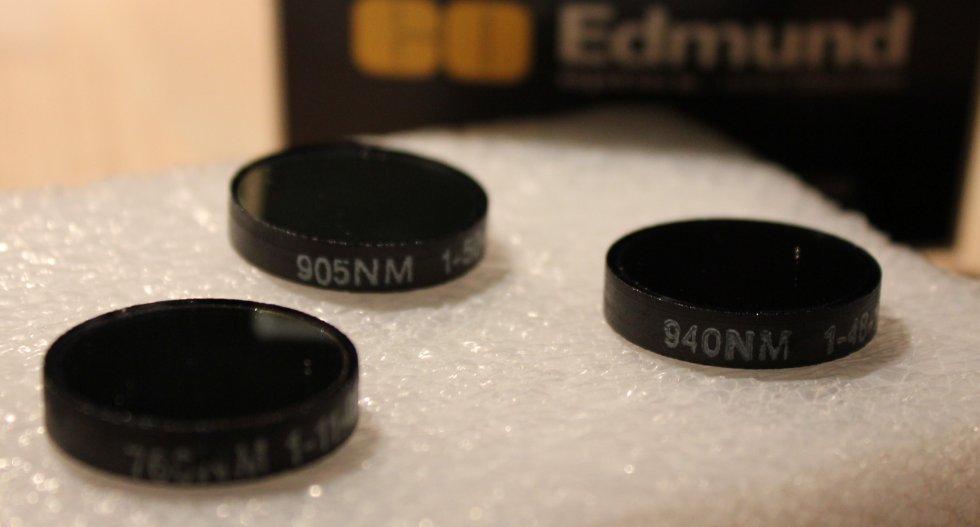
We will need narrowband filters for 415, 750, 905 and 950 bands - a bandpass filters. For the 1000 nm either a longpass (or a bandpass if you can't find a good longpass). The FWHM shouldn't be to narrow (image to dark) or to big. I think that 10-20 (or maybe even 30 nm) should be good. Even with good filters this will be very dark imaging as cameras have low sensitivity to such long wavelengths. Forget about using strong Barlows for high resolution.
Cheap filters can be found on ebay. A lot of them is in BJOMEJAG and OmegaFilters shops. You can also search terms like: "optical bandpass filter", "thorlabs", "edmund optics". Good filter should be a 25-20 mm diameter in shape. Small square filters (like common 11 mm) won't be so good (hard to mount them in 1,25" cells + they support only very small sensors).
Second source of filters is Thorlabs.de and EdmundOptics.com. They have higher prices but a full load of filters. Right now there is a sale of bandpass filters on EO: UV and IR.
An additional olivine filter could be made out of a silicon window - which is a pure silicon (not silica, quartz). It starts transmitting after 1000 nm and is extremely dark for cameras. With bright f-ratio it can give good lunary images (expect even 1-2 sec exposures).
If the filter is less than ~6 mm thick it can be mounted in the SkyWatcher plastic Moon Filter cells. If it's thicker the locking ring of the cell won't lock and you will have to lock the filter in the cell using other things (glue?).

Initial results
Here are two Moon areas imaged through the mafic/maturation filter set with C11, DMK21AU618 and 0.5x focal reducer. I didn't had the opportunity to check if the colors are accurate - more pictures needed. Everything below is my assumption based on images I got.
Mafic image has nearly no color so probably Anorthosite is the dominant soil there. Pinkish elements may be Ca-poor pyroxene like Noritic anorthosite. Greenish slight tint on the right edge may be from some olivines (Troctolitic anorthosite maybe?). Maturation ratio image shows which craters are "fresh" (and their fresh ejecta) - strong blue.
Maturation ratio image may say that upper part of the frame show mature highland soils (red/orange) (pyroxenes Ca-poor by mafic image). Blue color from Proclus and it's ejecta (+ other craters) show it's "fresh" not weathered soil. The mare can be ilmenite rich (bluish color) and yellow colors on the edges may indicate fresh mare soil and/or mafic components rich in iron (like olivines?). Steel-blue mafic colors of the mare surroundings may indicated high calcium pyroxenes.


Comment article